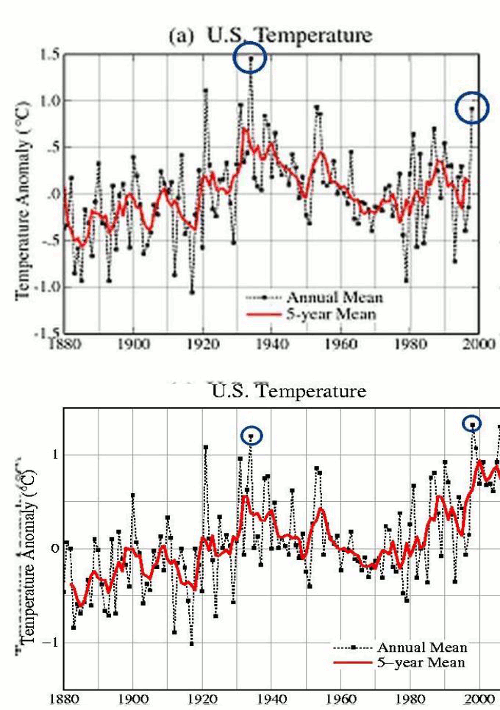
NASA/NOAA altered temperature data to show warming trend. The chart above cycles between raw U.S. data and the data as altered by NASA/NOAA. Watch the 1930s slump downward and the 1990s jump upward. And they’ve been performing this same trick on the rest of the world, too.
Author: J.P. Travis
Born and raised in Grand Rapids, Michigan, 1976 graduate of University of Michigan, father, grandfather, husband, founder and CEO of Travelyn Publishing (http://www.travelynpublishing.com/), and passionate anti-government believer in individual liberty.
View all posts by J.P. Travis